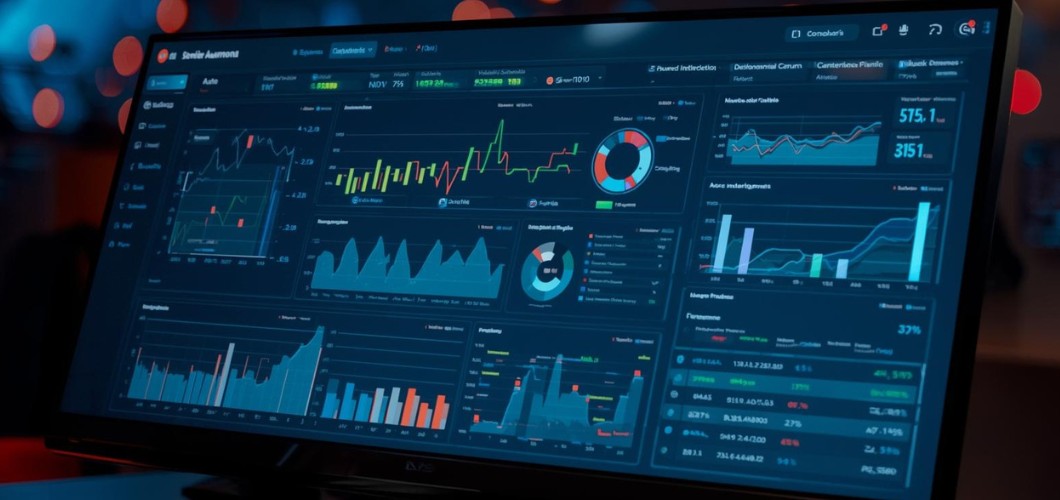
In the age of data, dashboards have become more than just tools. They are mirrors. They reflect who we are, how we make decisions, how transparent we are, how we structure power, and even how we treat learning and failure. Your business intelligence (BI) tool isn’t just telling you what’s happening in sales or operations; it’s whispering secrets (or beaming truths) about your culture.
Here’s what your dashboards are probably telling you, if you know how to read them.
1. Who Has Access = Who Matters
A BI tool’s permissions structure often reveals who is really “in the loop.”
• If only leadership and a few analysts can see the dashboards, your culture may lean toward hierarchy, gatekeeping, or even fear of sharing mistakes or data
• If dashboards are widely accessible, with self-service capabilities, it suggests trust, empowerment, and a more egalitarian mindset
Why it matters: Companies that promote data-driven decision-making by making data accessible to many tend to be more adaptable and aligned.
VMware’s example shows that when everybody can see dashboards and certified data sets through BI tools, people begin to act from a shared truth, reduce duplicated efforts, and feel more included in the organisation’s story.
2. Behavior of Dashboards = Behavioral Values
Dashboards reflect what you reward, what you track, and what you value as a company:
• KPIs That Stress Speed / Response-Times / Targets → you value agility, high performance, perhaps competition.
• Metrics on Collaboration, Learning, or Errors → you might be valuing humility, growth, safety to fail.
Also, dashboards and BI tools show how much you care about truth over appearance, if data quality, governance, and transparency are built into dashboards, it signals you want honest introspection, not just PR. VMware’s journey shows that uniform, certified data sets helped build coherence and trust.
3. Training & Support = Growth Mindset (or Lack Thereof)
A BI tool only helps if people know how to use it and feel safe to experiment with it.
• If training is routine, support is available, and people are encouraged to explore dashboards, not just be recipients of reports, your culture likely values learning, curiosity, and continuous improvement.
• If dashboards are more of a burden, or only understood by a few, then probably there’s either a tech-silo (or a people-silo), or a culture resistant to change.
Phocas, for example, highlights that unless everyone from finance to sales is trained and their roles respect analytic tools, a BI program may never truly embed itself in the culture.
4. Transparency & Feedback Loops = Openness & Trust
Dashboards that are visible to all, that refresh frequently, that allow users to comment/query or even challenge what they see indicate:
Trust: You trust people with the truth, even when it’s hard.
Psychological Safety: People feel safe to discuss unfavourable metrics.
Openness: You’re not hiding behind delays or data ambiguity.
Compare that with dashboards that are only updated monthly, or not shared, or whose sources are obscure; these suggest opacity, possible mistrust, or, at the very least, a lack of urgency for real-time monitoring.
From Lingaro’s piece: transparency increases engagement, helps clarity of purpose, gives people autonomy, and boosts motivation.
Conclusion
Dashboards are more than business intelligence tools. They are cultural artefacts. When you build, share, and act on dashboards, you send messages, about who you are, what you value, how you expect people to behave, and how you deal with good news and bad.
If you let dashboards reflect your best aspirations; transparency, growth, collaboration, you’ll likely build a culture where people trust the data and each other. If you let dashboards hide in silos or reward only short-term numbers, you might be reinforcing a very different kind of culture.
Also read: How AI Is Transforming Dashboard Design


